Number of SCI-level papers per full-time faculty member
Total External Research Grants Received
7%
Annual total amount of external research grants
Global Research Reputation
8%
Global evaluation statistical analysis
Research Funds per Faculty Member
3%
Research funds per full-time faculty member
Technology Transfer Revenue / Cases
5%
Total revenue and number of technology transfers
Number of Patent Registrations (Domestic/Overseas)
5%
Number of patent registrations per full-time faculty member
Educational Innovation (37%)
Full-time Faculty Ratio
8%
Ratio of full-time faculty to students
Global Educational Reputation
7%
Global evaluation statistical analysis
Disclosed Employment Rate
3%
Publicly disclosed employment rate of the most recent year
Sustained Employment Rate
2%
Sustained employment rate of the most recent year
Enrolled Student Fill Rate
5%
Fill rate of quota-capacity
Freshman Fill Rate
5%
Freshman fill rate for the current year
Educational Expenditure per Student
5%
Relative comparison of student educational expenditure
Scholarship per Student
2%
Institutional scholarship per student
Sustainability (25%)
University Brand Survey Evaluation
10%
University brand evaluation results of the current year
Student Dropout Rate
5%
Enrolled student satisfaction index
University Sustainability (ESG)
5%
Global evaluation statistical analysis
International Student Ratio
3%
Sustainable internationalization
International Faculty Ratio
2%
Global partnership
Total
100%
Fair evaluation management by University Evaluation Committee
Verification of Consistency/Coherence/Reliability
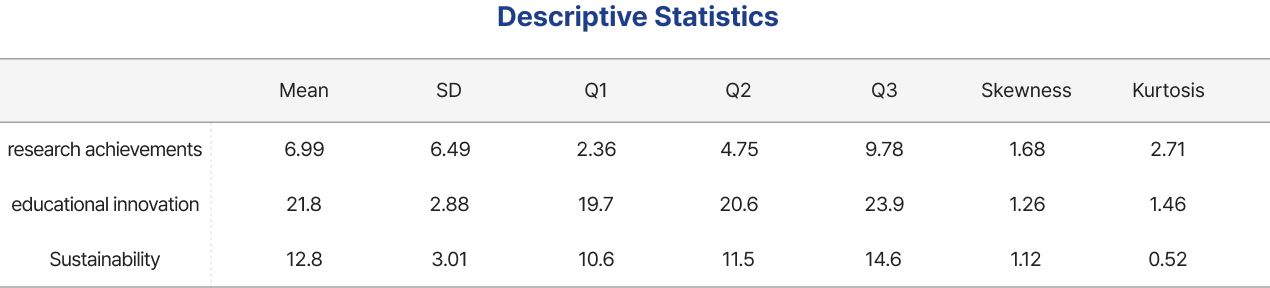
After collecting big data, it is checked based on six criteria: completeness, consistency, accuracy, uniqueness, validity, and timeliness to ensure no information is missing or contradictory, matches actual figures, is not duplicated, has valid meaning, and is up-to-date. By utilizing Cronbach’s α and McDonald’s ω, the consistency and reliability of detailed indicators are verified. This ensures that Research Performance, Education Innovation, and Sustainability all fully capture the original evaluation purpose, enabling the production of highly reliable evaluation results.
2025 INUE University Evaluation Result Analysis Data